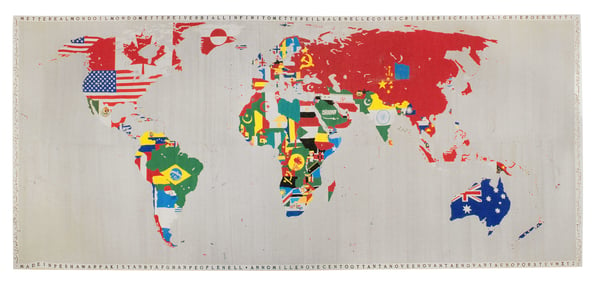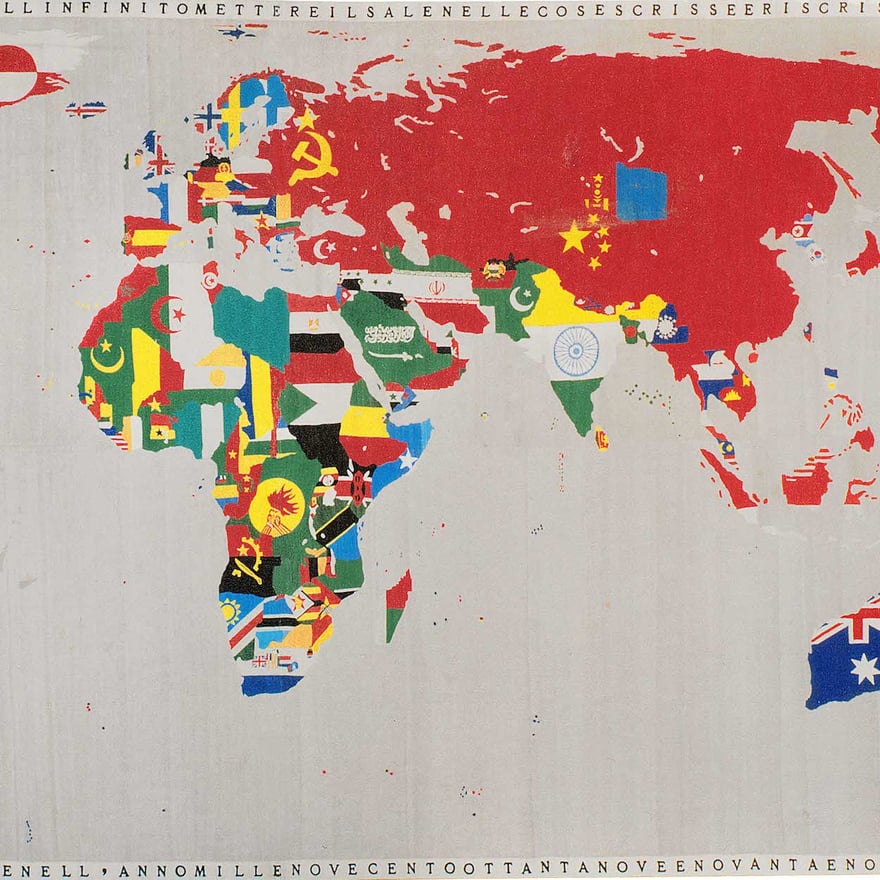
Alighiero Boetti, the Italian conceptual artist who began his career as a member of Arte Povera movement, is best known for his embroidered works made by artisans in Afghanistan and Pakistan. A series of embroidered maps representing the countries of the world by their flags and outlines created during a turbulent time in geopolitics between 1971 and 1994 have long been the works within Boetti’s body of work that the market values most. Already this Fall, one of those maps set a substantial new $5.5 million record for the artist at a sale in Paris in October. That topped a sale the year in before London at $4.5 million and another at $3.2 million the next day. Eight years earlier, a map work had set the previous record at $2.5 million.
The record isn’t likely to stay there. Sotheby’s is offering perhaps the largest map work—it’s more than eight feet tall and nearly 20 feet wide—with a low estimate of $8 million. If it sells there, the record will have doubled in a year. Of course, it could go much higher.
With so much activity in the Boetti market coming on seemingly without much warning, a detailed look at the artist’s market seemed to be in order. Records for the artist were set in 2010, 2014, 2021 and this year. That roughly coincides with the peak totals in Boetti’s auction market shown in the graph below.

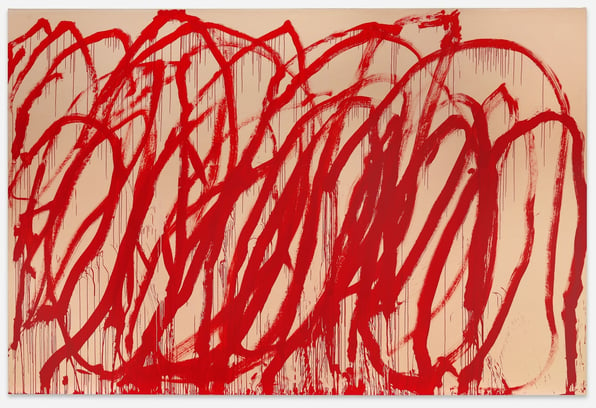
Total sales for Boetti first peaked in 2006 at $10 million. A year later, auction sales were $9.6 million. Four years later, sales peaked again at $16.7 million followed by $15.9 million a year later. In 2014, sales reached their all-time high of $29.3 million with another echo year of sales in 2015 at $25.4 million. Annual auction turnover trended downward for the next five years. But in 2021, sales rebounded to $24.8 million with the following year already at $12.2 million with two major works on offer in New York this November, Sotheby’s monumental map and at Christie’s a nearly as big—7 x 14 feet—Tutto work with a $3.5 million low estimate.
It looks like this twinning pattern—strangely appropriate for an artist who was entranced by dualities—last seen in 2006-7, 2010-11 and 2014-15 looks likely to continue. The run-up in prices from 2010-11 and continuing in 2014-2015, is most likely due to the exhibition, Alighiero Boetti: Game Plan, a huge retrospective of the artist’s work, which was shown at the Reina Sofia in Madrid, the Tate Modern in London and the Museum of Modern Art in New York over the year spanning October 2011 to October 2012.
Although the maps are among Boetti’s most valuable works—half of the top 20 prices for the artist were paid for maps—they are not the only body of work that is available on the auction market. To better understand the price dynamics for Boetti over the last two decades, we’ve created a chart of three different series within Boetti’s body of work. These are not the only series of works the artist made but we have enough examples in our auction database to be able to see some patterns.
Below is a chart of the auction sales for Maps (in brown on the chart), the works on paper created with ballpoint pens depicting airplanes (in light blue on the chart), and the small cinque x cinque or five-by-five embroidered works (seen in gold on the chart.) Each of these series sells at a different point on the price spectrum. Each has seen price appreciation over the last 20 years but at different rates.

As one can see for the chart, the maps remain at the top of the price spectrum. Because of their high value, map sales are clustered at market inflection points like 2011 and 2015. We’ve seen that the maps are selling again after a brief hiatus in the 2021 market and after. The chart shows that in the initial development of Boetti’s public market, prices for maps rose gradually from just under $100,000 in 1999 to a peak of just over $1 million in 2008.
In 2010, there is a dramatic shift in the market for map works. A new high price is set for a map at $2.7 million two days after one sells at the previous high price from three years earlier. Over the next eight years, maps sell for prices between the old high mark of $1.18 million set in 2007 and the new high of $2.7 million (with half a dozen prices just below the 2007 high.) In all, 24 maps sell in this period. Map prices don’t advance again until 2021.
During that period, the airplanes are rising in value four-figure prices to just over $100,000 in the period before 2003. There’s a brief pause in auction prices for airplanes. When sales resume in 2006, there’s a new floor for these works at $50,000. In 2007, a record for an airplane work is set at $344,039. Sales continue in the $50-100,000 price band until 2014 when there is a flurry of new sales above the 2007 high. From 2014 until 2021, there sales of airplane works continue within a new band between $100,000 and $500,000. There are an additional six sales between $500,000 and $1 million. Last year, an airplane broke through the million-dollar barrier.
The chart suggests that the consistent sales of maps at prices above $ 1 million allowed collectors to revalue the airplanes in a new price band ranging between $100,000 and $1 million depending upon the size and quality of the work.
At the bottom of the chart, one can see a similar pattern emerging with the five-by-five embroidered works. Tightly priced at or below $20,000 for the 2005-2010 period, the cinques jump to prices between $20 and $25,000 in the period from 2011 to 2015. The market for these works moves up a register again in the period from 2016 to 2020. Now the low prices around $25,000 and the high prices are at $45,000.
Again, the chart shows the cinque works rising in response to the movement of the airplanes. Correlation is not causation. But the chart actually suggests something else that may only be an effect of the chart. But it appears that the new higher prices for maps are built upon higher and more consistent value at the lower reaches of the price spectrum where the airplanes and the five-by-five embroidery pieces trade.
One final observation from the data. From 2001 until 2016, the number of lots auctioned saw a fairly consistent long-term rise. But since 2016, the number of lots auctioned has declined steadily. At the same time, average prices at auction have mostly moved upward. In 2021 and 2022, average prices broke out above their previous high in 2014. In 2021, the average price of a Boetti at auction was 57% higher than seven years earlier. So far in 2022, the average price is higher and, if Sotheby’s gets a good price, likely to go up from here.