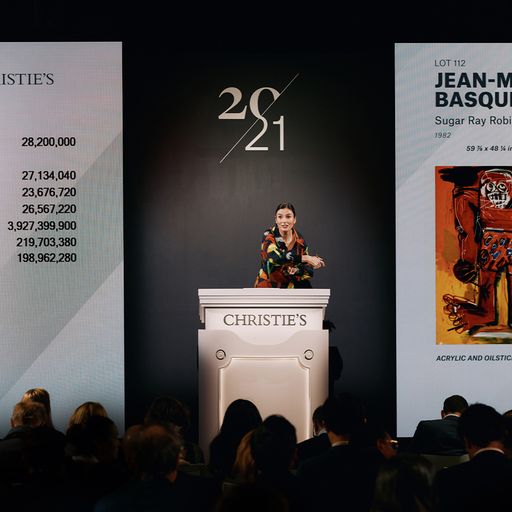
Three Billion Dollars Is a Lot of Money Spent on Art: The numbers don’t lie. The New York sale cycle totaled $3.19 billion, up $455 million from May’s sales and $650 million from the previous year’s sales.
The Market Is Fully Priced: Slightly more than half of that figure came from the sale of Paul G. Allen’s art collection. Perhaps because of that, the hammer ratio for the entire season was only slightly lower than May. This November the hammer ratio—or the total hammer price of all lots sold divided by the aggregate low estimate of all lots offered—was 1.10, a number which shows a slight weakening from the previous season’s 1.13 and a significant drop from the previous year when the hammer ratio was 1.28. Both previous seasons saw strong bidding from the Macklowe collection which contributed to the hammer ratio. This season, the hammer ratio for the Allen collection was 1.24. The percentage of sold lots that were bid above estimates has also declined from 47% a year ago to 42% in May and 33% this season.
Sold Lots Also Peaked: Sell-through rates have fallen slightly in 2022. During the November 2021 sales, the first after the pandemic closed auctions for a year and a half, 1401 lots were sold. In May of 2022, 1505 lots sold, an increase of 7.5%. This season, 1689 lots sold, another 15% increase. So buyers bought more work this season than before despite the uncertainty around the financial future.
Average Lot Value Remained Surprisingly Stable: We’ll discuss this more below but one would expect the Allen collection to have some significant effect on the average lot value. After all, it was a large collection with very high lot values. The average lot for the entire New York sales cycle this year was $1.89 million. In May, that number was $1.82 million and the year before it was $1.81m.
How Do We Calculate the Allen Effect? The entire Allen collection was 155 lots, or fewer than the overall increase from May to November this year. But the value of the collection was so large, $1.6 billion, that it constituted over half of the season total. The average price paid for an Allen work was $10.47 million which is more than five times what the average price has been in other seasons. If we take the remaining $1.59 billion in non-Allen lots sold and divide it by the number of non-Allen lots (1534), we get a much lower average price for art sold this season: $1.04 million.
A Barbell Market: These numbers suggest the market has bi-furcated. On one end, we have the Allen sale with an average price of $10 million; and, on the other other end, we have the rest of the market with an average price that is only $1 million or a tenth of the Allen sale value. Because the Macklowe collection was sold in two tranches across two seasons, its effects were less visible. Or, seen another way, the so-called masterpiece market of trophy works like those in Macklowe and Allen masks a weakening of the overall market. The deceleration everyone has been fearing in the art market has actually arrived this season, we just don’t see it as dramatically because the Allen works.
What Can We Expect in the Future? Barring another major collection coming to market (and it is well-known in the industry that Allen’s estate still contains a significant number of works—not to mention many other major collections that are coming to term), the auction houses will (or should) see these numbers and begin to be more selective in the works they accept for their sales. A 30% reduction in lots sold from 1700 to around 1200 lots and a corresponding 30% drop in overall sales from $3.19 billion to approximately $2.2 billion would still have an average lot value for the sales of $1.8 million. That may look like a nightmare scenario from current levels but it actually represents an increase in non-Allen sales volume from $1.59 billion to $2.2 billion and assumes there is both demand from collectors (with the financial resources to spend) and work to attract that demand.
Can the Market Continue to Broaden?

There Is No Dominant Artist This Season: In the past, the market has tended to favor a few very valuable artists along with some other quite valuable artists. It was not uncommon for a sales cycle to be dominated by Pablo Picasso, Andy Warhol or Claude Monet with 12 to 15% market share or more. Other artists like Jean-Michel Basquiat, Gerhard Richter, Mark Rothko and Cy Twombly could occasionally approach those levels or capture significant market share a rung below the trio of top artists. Because of the Paul Allen sale and the high value of artists like Seurat, Cézanne, van Gogh and Gauguin in that sale, market share is more evenly distributed among artists but still includes Warhol, Picasso and Monet.
Women Have Not Reached Equity but … The top 12 artists by market share this season are all men. That’s not terribly surprising. Market share doesn’t measure artistic merit or art historical significance. It can vary widely from season to season based upon the number and types of work by any given artist on offer. That said, it is interesting to see this season that a number of prominent women artists have claimed similar market share to prominent male artists. For example, 10% more dollars were spent on Georgia O’Keeffe’s art than on Cy Twombly’s art during this sale cycle. Joan Mitchell and Gerhard Richter both had art sell for just above $30 million. Yayoi Kusama outsold Jeff Koons. Tamara de Lempicka had sales almost equal to Diego Rivera. The point of the table below is not to say that women artists are now on the same footing as men. Artists’ markets are complex and driven by numerous factors. But these comparisons present some fleeting measure that suggests demand for art by women continues to rise.